Articles by Results

Graham Cripps

Recent Posts

Getting More For Less - The 8 Wastes

Posted by Graham Cripps on Tue, Jul 14, 2015 @ 01:32 PM

Getting More For Less - The 8 Wastes

Where do you go from here? You have cut back on staff, got the best prices on materials, you are energy efficient but you are still under pressure on pricing? This is a common dilemma in business.

There is always room for making substantial improvements however, particularly in the areas of Quality, Cost and Delivery, by taking a fresh look at everything you do in terms of the 8 Wastes.

Associated with Lean Manufacturing the 8 Wastes are:

Travel - excessive movement of product, stock, materials etc

Inventory - too much stock, work in progress (WIP), raw materials or supplies

Motion - unnecessary operative / staff movement

Waiting - idle time between operations or activity

Over Processing - doing more than is required by the customer(s)

Over Production - producing more than is necessary

Defects - errors, poor quality, rework and scrap

Skills - not fully utilising the skills available within the business

The acronym 'TIMWOODS' is used as a means of remembering these wastes. 

Identifying waste is a critical task in any business and should be within everyone's role or remit. However, this should be approached with caution as it can result in the creation of a blame culture.

Reducing Waste

Waste identification is a good thing. The ability to identify waste in the business, and to have strategies for dealing with the wastes identified can prove to be very cost effective in terms of the effort involved.

You can use the simple Waste Matrix below to provide an overview of the symptoms of waste which may be present within your organisation and to identify some of the strategies and tools for dealing with them.

Waste reduction needs to be part of an overall improvement strategy, whether you use a Lean approach, Six Sigma tools or any other Continuous Improvement methodology, the objective of any change should be focused upon:

  • Reducing Costs
  • Improving Quality
  • Improving Delivery

These measures are referred to as Q C D

New Call-to-action


Topics: Root Cause, root cause analysis, Global 8D, G8D, Interim Containment Action, Permenant Corrective Action, Is/Is Not, problem prevention, Problem Desciption, 8D, 8D benefits, Problem solving, Continuous Improvement, ICA, decision making

SPC - Probability And SPC

Posted by Graham Cripps on Mon, Jul 13, 2015 @ 02:39 PM

Probability And SPC

Welcome to the third article in the 'Explaining SPC' series, written by our Subject Specialist Graham Cripps.


Probability is the statistical method for predicting the chances of a single or series of events actually happening.

For example, if I toss a coin in the air, assuming no other influences are present, I can predict that I will get either heads or tails - two possible outcomes from one event. This can be expressed as:

  • The probablity of a head is 1/2
  • The probability of a tail is 1/2

If I now consider having two coins that are tossed then the outcome could be the same for each coin. However, if we consider that the outcome we are looking for is all heads, then we can see that the outcomes could be:

SPC_B3_P1

We can see that we have four possible outcomes so the probability of one of these is 1/4 (or 1/2 x 1/2).

If we had seven coins, the probability of getting all heads, or any other outcome, would be:

1/2 x 1/2 x 1/2 x 1/2 x 1/2 x 1/2 x 1/2 = 1/128

This is usually written as 27 (2 to the power of 7). In other words, two possible outcomes from seven different coins.

Variation

Variation is present in all things - be it manufacturing a shaft, filling a milk bottle or formulating ink colour, there will be some degree of variation.

There are two types of causes of variation:

  • Common Causes
  • Special Causes

Common Causes are due to the natural variation, always present in and around a process, under normal running conditions. These will include those coming from man, machine, measurement, materials, equipment, methods and environment (both internal and external environments).

Special Causes are due to a change condition, something has changed in or around the process that is abnormal.

A process that has only common causes present is said to be in control. In other words, the outcome of a process can be predicted within the realms of probability.

SPC can only be applied on a process that is in control as predicting special causes of variation is not feasible.

So let us take a look at how SPC can predict an outcome based upon the output of the process itself.

SPC - Predicting Outcomes

A process has been measured for a few days. The data gathered is based upon a sample size of five taken every hour. The data has been plotted on a histogram and we have calculated the mean of the data (mean of all the means, X-bar), the range and the distribution (the sigma value or σ)

SPC_B3_P2This diagram describes the past process output, based upon the data gathered. If we consider plus or minus three sigma (+ - 3σ), it is a function of a normal distribution that 68.27% falls within the cente third, 95.45% within the centre two thirds and 99.73% within + - 3σ.

Only 0.23% of all data falls outside of + - 3σ.

Finally, the data is equally spread about the mean.

These statistical facts form the basis of the application theory of SPC

Let me explain how this works. For any set of sample data from now on (sample of five) we can predict that the data points will follow these patterns.

So the likelihood that seven sets of consecutive samples behave outside of these patterns (i.e. one single outcome repeated from eight possible outcomes) then the probability against would be 1 / 128.

The eight possible outcomes for sub-group values are:

  • All above the mean
  • All below the mean
  • All within the + - 1σ
  • All within the + - 2σ
  • In one half of the distribution
  • All going up
  • All going down
  • In the outer 1/3 area

We will come back to this again in future articles

Download Your SPC Dice Plotting Exercise

As always please let us know if you have any questions or feedback, you can call us on 01371 859 344 or contact by email us on julie.camp@resultsresults.co.uk 

Topics: Continuous Improvement, Statistical Process Control, SPC

SPC - The Basic Statistics Behind SPC

Posted by Graham Cripps on Thu, Jul 09, 2015 @ 03:04 PM

SPC - The Basic Statistics Behind SPC

This is the second article in our SPC Blog series, aiming to provide a background to the statistics behind Statistical Process Control (SPC) for variable data.

Variable data is derived from anything that can be measured and includes length, diameter, hardness, distance, volume, mass and gloss levels to name but a few.

Basic Statistics are used to convert large amounts of data into a more meaningful form. For me, this is about making pictures from numbers.

SPC requires information or data to be described using three terms:-

  • Location - where the data is located on a line of continuum
  • Spread - the smallest to largest measurement taken
  • Distribution - the way the data is located relative to a central data value

Location - Measures Of Central Tendency

Central tendency describes the location of a set of data. The three descriptors are mean, mode and median.

  • MEAN is the arithmetic mean or average
  • MODE describes the most frequently occurring value
  • MEDIAN is the value of the middle value when all the data is arranged in ascending order

The following two slides illustrate the calculations for all three of these measures (Mean, Mode and Median)

SPC_B2_P1       SPC_B2_P2


Where these measures are useful depends on the data set you are using. For example we will use the mean value and sub-group size of 5 samples. Having sub-group samples means we can take advantage of the central limit theorem to be abe to manage data analysis from normalised values.

This provides the advantage of reviewing the data as a normally distributed set of data (more about this in the next article)

Spread

This is simply the difference between the largest and smallest data points or measurements.

Distribution - Measure Of Dispersion

Measures of dispersion define the spread of data and the overall shape of the data. 

If we consider a simple histogram then we can see that there is more than one measure needed to describe the data set.


SPC_B2_P3
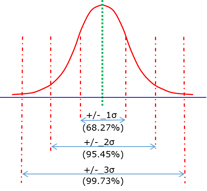
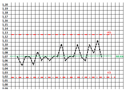
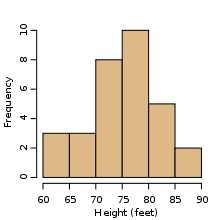
This diagram shows a typical histogram for a linear set of data. This type of graph is very useful for visualising small or large sets of data points, in terms of the distribution, and can be produced using Microsoft Excel.

However, for us to analyse this data further, we would need to overlay a distribution curve for this data.


SPC_B2_P4


This diagram illustrates three sets of data, all centred on the same value, but the spread and shape of the data sets vary (the spread is the difference between the highest data value and the lowest data value)

You will also notice that, although the last two data sets share the same location and the same spread, the shape is different.


So we use three descriptors to describe the data:

  • location
  • spread
  • shape of the data

Summary

Location is defined by the mean, mode or median value (the diagram above shows the mean for a normal distribution)

Spread is defined by the range (R) value for the data (difference between the highest and latest data points in absolute values).

Shape of the data is defined by the variance (the average of the squared differences from the mean) and is commonly referred to as the sigma (σ) value.

Download your 6σ Conversion Chart 

Topics: Continuous Improvement, Statistical Process Control, SPC

SPC - Understanding Statistical Process Control

Posted by Graham Cripps on Mon, Jul 06, 2015 @ 12:07 PM

Understanding Statistical Process Control (SPC)

Having reviewed feedback from visitors to our website we have found that we get a lot of requests for information on Statistical Process Control (SPC).

SPC_blog_chart_1We will be launching a series of articles during the next couple of weeks that aim to provide a foundation understanding of SPC and it's application, this will hopefully help you make an informed choice about whether SPC is the correct tool for you!

Our intention is to provide a solid foundation for understanding SPC, the terminology, metrics and uses of SPC along with  useful resources which can be downloaded and customised to suit your specific requirements, the first of which (X-bar and R chart) is available below.

My job takes me into all types of business, and I often find SPC charts being displayed, but when I ask the client they are either not correctly used or not correctly interpreted.

SPC_blog_chart_2
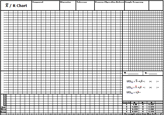
The articles will be broken down into small bite size offerings that can be used for future reference. We will also be making available the relevant resources, including an SPC chart, calculation sheets and a table of constants along with some recommended further reading.


The information will be split into the following articles for ease:

  • The basic statistics behind SPC (for variable data)
  • Probability and SPC
  • Collecting and plotting data (using the X-bar and R chart)
  • Interpreting the chart, including the seven points rule
  • Understanding capability
  • Applying SPC

The article structure will be on our website so if there is something that interests you, keep an eye out!  You can sign up to receive notifications to our Blogs here and our Facebook page can be found here.

If there are any SPC questions we haven't answered, or for any queries or feedback, let us know either via the contact form here or by emailing julie.camp@resultsresults.co.uk


New Call-to-action


Topics: six sigma, Statistical Process Control, SPC

Global 8D (G8D) Frequently Asked Questions (FAQ's)

Posted by Graham Cripps on Thu, Jul 02, 2015 @ 10:59 AM

Global 8D (G8D) - Frequently asked questions (FAQ's)!

The latest in our series of FAQ's answered by our Subject Specialist, Graham Cripps

If the answer to your question is not shown here why not use our 'Ask Us A Question' Form to get an answer from our Subject Specialists!

"When I am asked for an 8D by my customer is it just the 8D Form they want?"

The short answer is NO, however you may not have got to the root cause in the time they give you to provide the 8D.

The G8D Form is a means of recording and reporting the problem solving effort. At D0 you should have implemented an Emergency Response Action (ERA) which must protect your customer from the effects of the problem. This is what the customer needs to see as quickly as possible.

Don't forget, other than the initial effect (or symptom) of the problem, the ERA can also introduce an effect in itself e.g. a supply constraint, so make sure these are included as part of your ERA.

Finally, you should always confirm understanding with your customer.


 Download Your G8D Problem Solving Workbook

"Do I need to use Global 8D for every problem I encounter?"

I need to answer this in two parts:

1. When to use a full Global 8D - there are some simple rules to follow. G8D should be applied to those problems that have:

  • definition of the symptom(s), that is the symptom has been quantified
  • identified the customer(s) and affected parties who experienced, or are experiencing, the symptom(s)
  • measurements to quantify the symptom(s) and demonstrate that a performance gap exists and / or that the priority (severity, urgency, growth) of the symptom warrants initiation of the process
  • an unknown cause
  • management commitment to dedicating the necessary resources to fix the problem at Root Cause Level and to prevent recurrence
  • a problem symptom complexity that exceeds the abillity of one person to solve the problem

2. The problem solving process is all about getting to root cause, eliminating the root cause and then fixing the reason why the problemm occurred in the first place. It matters not what process you use but I would suggest that the Global 8D steps offer everything a determined problem solver could want. You will clearly define the problem, protect your customer, get to root cause and make sure it stays fixed by addressing what allowed it to occur in the first place.


Download Your Global 8D Assessing Questions


"Is Global 8D the only problem solving tool to use?"

There are many tools and techniques available but I have found that there are two approaches that have served me well.

1. Global 8D is applied to those bigger problems that have:

  • definition of the symptom(s), that is the symptomhas been quantified
  • identified the customer(s) and affected parties who experienced, or are experiencing, the symptom(s)
  • measurements to quantify the symptom(s) and demonstrate that a performance gap exists and / or that the priority (severity, urgency, growth) of the symptom warrants initiation of the process
  • an unknown cause
  • management commitment to dedicating the necessary resources to fix the problem at Root Cause Level and to prevent recurrence
  • a problem symptom complexity that exceeds the abillity of one person to solve the problem

2. The 5 WHY's (5Y's) is the other very useful tool. However I would recommend that you follow these basic steps:

  • define the problem by describing 'What is wrong with what?'
  • protect the customer (internal or external)
  • describe the problem fully (what? when? where? and how big?, using real data)
  • brainstorm all of the possible causes of the problem (not of the effect or symptom!)
  • arrange on a fishbone diagram
  • Use 5Y's to drill down to root cause level
  • develop causal theories that can describe how the root cause(s) results in the problem and the effect
  • test and verify potential root causes to get to verified root cause
  • determine and implement the 'best' permanent corrective action(s)
  • make it the new way of running the process


Download Your Global 8D Assessing Questions


"How will Global 8D help my business?"

If you have ever said, or heard said "The last time we had this problem we did this" or "Why does this problem keep coming back?", then you did not get the problem solved!

Global 8D has the discipline to ensure that not only is the problem solved at root cause but what allowed the problem to happen is also fixed (the root cause of the root cause)

It's true to say that Global 8D should not be used for every problem. In fact something like only 5% of problems warrant the full use of this problem solving methodology. 

Other methods are available but again, I would recommend using the same steps as G8D for all problems to ensure you ask all the right questions at the right time and fix the problem at root cause permanently. 

Download Your Problem Solving Case Study

"Do I need to have a team trained for Global 8D?"

Yes but there are many ways of achieving this, from a standard instructor led programme to self-tutoring using available materials. The best way, in my opinion, is to have a Problem Solving Application Workshop run, which will deal with and resolve a live problem whilst training the team how to use the tools and techniques of Global 8D.

Download Your G8D Problem Solving Workbook

Global 8D Application Support Workshop


Why not have a look at our Global 8D Overview page, where you will find all of our templates, reports and other useful documents available for FREE download.

Topics: root cause analysis, Global 8D, G8D, Interim Containment Action, Permenant Corrective Action, Is/Is Not, problem prevention, Problem Desciption, 8D, 8D benefits, Problem solving, Continuous Improvement, ICA, decision making

Poka Yoke Inside & Outside Of Manufacturing

Posted by Graham Cripps on Wed, Jul 01, 2015 @ 08:22 AM

Poka Yoke Inside & Outside Of Manufacturing

For some time Lean has been associated with manufacturing, primarily automotive. However all of the tools, techniques and overall philosophy can be appplied to all types of industries

Poka Yoke, or error proofing, can be used wherever errors may occur, be it manufacturing, process, banking, pharmaceutical, agriculture or the leisure industry.

Error proofing is used in our every-day lives, so why not employ this in your business?

The following table gives a flavour of how error proofing can be applied so that quality can be built into your business processes:

Poke_Yoke_table_for_blog

Poka Yoke is applicable in most business types but you must ensure that it becomes just another business process so that any changes made to the process become the new way. In other words, the change is sustained....

Visit our Poka Yoke pages and download the resources below.

Download your FREE Poka Yoke PowerPoint here!

Download your FREE Poka Yoke Worksheet Here!

Topics: Design FMEA, DFMEA, Continuous Improvement, Poka Yoke, error proofing

Stress Management - Recommended Reading List

Posted by Graham Cripps on Fri, Jun 26, 2015 @ 04:21 PM

Recommended Reading List - Stress Management

The following books have been recommended by our Subject Specialists for further information on thinking style and 'reprogramming' of thought patterns and resultant behaviour:

MIND OVER MOOD             mind_over_mood_pic
By: Denis Greenburger and Christine Padesky
Publisher: Guilford Press
ISBN: 0-89862-128-3
Looks at changing the way we feel by changing the way we think
     being_happy_picBEING HAPPY                   
By: Andrew Matthews
Publisher: Media Masters
ISBN: 981-00-0664-0
A lighthearted look at how we see ourselves and the behaviours we adopt. The author is a cartoonist, and this is an easy and fun read with some really deep messages
STOP THINKING & START LIVING      stop_thinking_pic
By: Richard Carlson
Publisher: Thorsons
ISBN: 0-7225-3547-3
Looks at how being happy enables us to lead a fuller life and have more of what we really want as a result. 
    harnessing_the_parabrain_picHARNESSING THE PARABRAIN
By: Tony Buzan
Publisher: Colt Books
ISBN: 0905899016
Explains how we can harness the power of our brain to get us thinking more positively and more appropriately for us
We hope you find this list useful, more recommended reading lists to follow!


If you have any queries please do not hesitate to contact the Results Team on 01371 859 344

Topics: Stress Management

Problem Solving & Ishikawa

Posted by Graham Cripps on Tue, Jun 23, 2015 @ 04:33 PM

Problem Solving & Ishikawa

Last month I was asked by one of our clients"Where do Global 8D, Ishikawa and Brainstorming fit into the problem solving effort?"

A simple enough question, so I thought I would share the answer as this maybe something that someone else may like to know!

Global 8D (G8D)

G8D is widely recognised throughout the Automotive, Aersopace and Pharma industries as a leading edge methodology. However, this tool should be reserved for a small number of problems (normally less that 5% of all problems), which typically require more than one person to resolve, are complex in nature and whose cause is unknown. Also, because of the nature of this methodology, the resource needed to solve the problem would be less than the cost of the problem (or the effects of the problem).

For the majority of problems G8D is more than is required, however some of the techniques used are useful from time to time e.g. Is / Is Not Analysis, Differences & Changes, Root Cause Theory as part of Root Cause Analysis.

Ishikawa And Problem Solving

Ishikawa diagrams (also known as Fish Bone diagrams) are most commonly associated with problem solving.

However Ishikawa is widely used alongside other tools and processes, including but not restricted to:

In problem solving terms, the Ishikawa diagram is used to organise the output of a brainstorming session

The brainstorm is about establishing possible root causes to a problem that has been fully described (by this I mean we know what is wrong with what!), the problem description to root cause analysis phase

Be careful not confuse the problem with the effect, its the problem we need to solve, NOT the effects of the problem

Ishikawa (Fishbone) Diagram And Root Cause Analysis

Problem solving is a process of elimination through the use of data and analytical tools, driven by clear logical thinking.

The effect or symptom is what is experienced, this is caused by the problem, which in turn has a root cause.

To establish the root cause we first have to ensure we fully describe the problem using facts. The cause is determined in three levels, as seen in this diagram, and Possible Causes are the output of a brainstorming event.

cause_and_effect_flow

We use the Ishikawa diagram to give the brainstorm  some order. Common 'bones' are Man, Equipment, Machine, Environment and Material (MEPEM). The brainstorm output would be placed against each 'bone' (see diagram below). 

In Problem Solving terms, the next stage woul be to ask 'WHY?' for each possible cause until you can go no further. Once you have considered this final answer (5 WHY's), established that the causal theory explains why the problem occurs only on the affected items, then you will have a potential root cause.

A causal theory is a statement that describes how a potential root cause initiates the problem and the effect experienced.

Example:

Problem Scenario: Every time I leave my car for more than a day without running the engine, it will not start

Problem Description: Car will not start

Possible Cause: Faulty battery

Causal Theory: The battery does not hold a charge for more than 24 hours. Over time there is not enough power to operate the starter motor so the car will not start.

Ishikawa_diagram_-_car_battery


G8D SnapShot   New Call-to-action Global 8D ppt

Topics: Root Cause, root cause analysis, Global 8D, G8D, 8D, Problem solving

Train The Trainer (T3) - Why?

Posted by Graham Cripps on Tue, Jun 23, 2015 @ 11:32 AM

Train The Trainer (T3)

demingLeading Quality Guru, Dr W Edwards Deming (1900 - 1993), once said "The individual, once transformed, will set an example, be a good listerner and continually teach other people"

Our mission is to 'transfer our skills' to our clients. In order to facilitate this goal we provide free access to our resouces via our website and we offer Train The Trainer Workshops that provide on site development of your existing training resource. These workshops are designed to meet your specific reqirements and required outputs.

Delivered by accredited subject specialists, we offer T3 Workshops in a number of subjects including:

  • Global 8D Problem Solving
  • FMEA (workshop covers both Design and Process FMEA)
  • 5S & Workplace Organisation
  • SMED (Single Minute Exchange of Dies)
  • APQP (Advanced Product Quality Planning)
  • Poka Yoke (Error Proofing)

Workshop Overview

The workshop will cover all of the subject matter training, as well as the tools and techniques necessary for the parricipants to be able to deliver in-house training and support. The sessions include:

  • Subject matter knowledge (including transfer of the delivery and support materials to enable on site delivery)
  • Facilitatin of application (how to facilitate in-house activity)
  • Giving and receiving feedback
  • Goal setting and action planning
  • Dealing with learners needs
  • Learning and communication styles
  • Assessing learning gain
  • Initiating and sustaining behavioural change


New Call-to-action


Topics: Train The Trainer (T3)

Six Sigma - What is it and what can it do for my Organisation?

Posted by Graham Cripps on Thu, Jun 18, 2015 @ 04:45 PM

Six Sigma (6σ) 

6σ is a disciplined, data-driven approach and methodology for reduction of variation in any process – from manufacturing to transactional, product to service and in many organisations, 6σ refers to a measure of quality that continually strives for near perfection (minimal variation in all processes).

The idea behind 6σ is that if you understand your processes you can systematically establish all sources of variation and work to reduce the variation.

Useful Resources:  Sigma Conversion Chart, DMAIC Structure, Six Sigma Blog

6σ Fundamentals

Six Sigma is based on some fundamental principles, these are:

  • Y=f(X) - All process outcomes (the Y) are a function of the inputs (the Xs) and the process itself. This takes into account the known variation
  • To reduce variation in the process output (the Y), you have to focus on the inputs (the X’s) and the process itself (the f)
  • Variation is everywhere, it is a fact of life but must be understood and managed. The point of utilising 6σ tools and techniques is to understand the variation and minimise it!
  • Valid measurements and data are required foundations for consistent improvement.
  • Only a critical few inputs and process steps have significant effect on the output. Concentrate on the critical few

6σ Measures

The measures for 6σ that are used are:

  • DPMO – defects per million opportunities
  • Yield – percentage yield of the process
  • Process σ – the measure of dispersion of the process output about the mean

Having a process sigma value of 6σ (+/- 6σ) will reflect a process that will, over time, produce no more than 3.4 defects per million outcomes.


DMAIC – Define, Measure, Analyse, Improve, Control (plus Replicate)

The DMAIC project method is a formalised problem-solving process. The five steps to can be applied to any procedure of a business to improve effectiveness.

  1. Define: Set the context and objectives for your improvement project.
  2. MeasureDetermine the baseline performance and capability of the process or system you’re improving.
  3. AnalyseUse data and tools to understand the variation in the process, their root causes and effects on other processes
  4. ImproveDevelop the modifications that lead to a validated improvement at root causes level in your process or system.
  5. ControlEstablish plans and procedures to ensure that your improvements are sustained, the new way.

PLUS – ReplicateTake the lessons learnt to improve similar products or processes


6σ Hierarchy

6σ is driven via a tiered system of technicians, whose level of authority and responsibility is denoted by their belt colour’ –Yellow Belt, Green Belt, Black Belt, Master Black belt

Yellow Belt – active member of a project team with a basic understanding of the Six Sigma tools and familiar with the DMAIC process. The Yellow Belts main function is data collection and problem solving and they will be heavily involved during the project testing and implementation stages of a project.

Green Belt – are more conversant with each of the five steps (DMAIC) and the tools and techniques used. They are supervised by the Black Belt and will assist at all stages of a project, but are heavily involved at the implementation stage of any project in their operational area. Green Belts may also lead teams on small improvement projects

Black Belt – will have a clear working understanding of and the ability to use Six Sigma principles, tools and techniques. They provide the lead on improvement project teams in areas outside their own operational area as they have a good understanding of the organisation as a whole. They will possess leadership skills and understand the dynamics of a team, able to assign roles and responsibilities within their teams as appropriate and required, with the ability to motivate these teams through the DMAIC process to accept and implement the required changes. They will lead teams and projects to drive through improvements in product and service delivery processes. They will also participate in the training and development of the Yellow and Green Belts in the required tools and techniques required.

Master Black Belt – experts in the tools and techniques of Six Sigma, and responsible for the planning of the improvement projects, normally in conjunction with the Senior Management Team (sometimes supported by a Champion / Sponsor). In order to attain Master Black Belt status they will have completed at least three projects at Black Belt level and the role is normally full time with the Master lack Belt managing several concurrent projects cross functional teams


Topics: six sigma

Subscribe via E-mail

Latest Posts

Posts by category

Follow Me