Articles by Results

5S - Why & How?

Posted by Julie Camp on Fri, Jul 17, 2015 @ 03:02 PM

5S - Why and How!

new_5s_snapshot_for_web_page


Our Subject Specialist, Jim Killeen, walks you through the philosophy behind 5S and what is required to implement this tool.

Available now on our YouTube Channel - Now Take Control, you can find it here

For the accompanying documentation please click here to download, all are editable versions for you to customise and use


If you have any questions about the 5S process and its implementations or would like to speak to us about your specific requirements please let us know. You can call us on 01371 859 344, email to julie.camp@resultsresults.co.uk or submit your query via the button below

We look forward to hearing from you!

The Results Team


Topics: 5S, Workplace Organisation, Continuous Improvement

Subject Specialist Graham Cripps Explains G8D Step 2 - Describe The Problem

Posted by Graham Cripps on Thu, Jul 16, 2015 @ 01:28 PM

Global 8D - Step 2: Describe The Problem

graham_cripps_dec_2010_formal
Our Subject Specialist, Graham Cripps, walks you through Step 2 of the Global 8D process - Describe The Problem

Available now on our YouTube Channel - Now Take Control, you can find it here.

Other videos, describing each of the steps, will be available shortly

For the accompanying documentation please click here to download. An editable version of this document is available here.


If you have any questions about the Global 8D process and would like to speak to us about your specific requirements please let us know. You can call us on 01371 859 344, email to julie.camp@resultsresults.co.uk or submit your query via the button below

We look forward to hearing from you!

The Results Team

Answer My G8D Question Please!

Topics: Global 8D, G8D, Problem Desciption, Problem solving, Continuous Improvement

SPC - Collecting & Plotting Data

Posted by Graham Cripps on Thu, Jul 16, 2015 @ 01:00 PM

SPC - Collecting & Plotting Data

Data Collection

When planning to set up SPC on a process there are a few rules that need to be observed:

  • Data source* - the data to be collected should be from one source only, in other words avoid collecting data from:
    • More than one process
    • More than one tool
    • More than one mould or casting cavity
    • More than one measuring station
  • Data Type - data must be variable data (something that can be measured)
  • Characteristic - should be restricted to those that are critical in terms of customer satisfaction, or identified as critical as part of the FMEA output.

* Date that is collected from more than one source will contain the variance between the two sources and will make it difficult (if not impossible!) to predict outcomes. It can even be misleading, in terms of interpretation of the completed SPC Chart. This will be fully explained in the next article 'Interpreting The Chart'

For the purpose of this exercise we will use some data that is from a manufacturing process, the diameter of a small shaft. The data is arranged from top to bottom, starting in the top left corner (1.071, 1.032, 1.164 etc).

The measurements are taken approximately every thirty minutes and five consecutive samples are taken each time

SPC_B4_P1

The shaft specification is 1.100 mm diameter + / - 0.010mm.

Plotting Data

We will now go through the process of filling in the data and calculating the various parameters to enable the results to be plotted, we will cover step by step. The plotting will take place in three areas as shown below:

SPC_B4_P2


SPC_B4_P3


Step 1: For each sub-group record the individual values then calculate the mean value of this sub-group.

Example:   (1.071+1.032+1.164+1.041+1.064) ÷ 5 = 5.372 ÷ 2 = 1.0744 ( X-bar).


Step 2: Calculate the range of this sub-group.

Example: 1.164 (largest Number) – 1.032 (smallest value) = 0.132

Note: When beginning a new SPC project it is best to run at least twenty sub-groups before attempting to plot the data. This will allow you to select the best fit for the graphs (more about this in the next article).

Step 3: Calculate the average of all the averages for X. This is the sum of all the averages divided by the number of sub- groups:

SPC_B4_P7

Step 4: Calculate the average for the ranges (R-bar). This is the sum of all the ranges for each sub group divided by the number of sub groups:

SPC_B4_P8


Step 5: Determine the scales for plotting:

  • The range values
  • The X-bar values

Step 6: Plot the range values and the X-bar values

Plot of the range values R

SPC_B4_P4

Plot of the average values X-bar

SPC_B4_P5

Step 7: Calculate and plot the control limits for range R and sub-group averages X-bar

SPC_B4_P6


There is a completed  example chart, using the data provided in this article, that can be downloaded (see below) that will enable you to follow this example.

This will also be referred to in the next article


Step 8: Plot the individual vales. To do this you will need to determine the intervals and the scale for plotting. Remember, the individuals should not be compared to the plot of X-bar as these are the average values of the sub-groups.

In the next article we will be discussing how to interpret an example of a completed chart.

SPC X-bar & R Chart (Completed) Download

Topics: Continuous Improvement, Statistical Process Control, SPC

Getting More For Less - The 8 Wastes

Posted by Graham Cripps on Tue, Jul 14, 2015 @ 01:32 PM

Getting More For Less - The 8 Wastes

Where do you go from here? You have cut back on staff, got the best prices on materials, you are energy efficient but you are still under pressure on pricing? This is a common dilemma in business.

There is always room for making substantial improvements however, particularly in the areas of Quality, Cost and Delivery, by taking a fresh look at everything you do in terms of the 8 Wastes.

Associated with Lean Manufacturing the 8 Wastes are:

Travel - excessive movement of product, stock, materials etc

Inventory - too much stock, work in progress (WIP), raw materials or supplies

Motion - unnecessary operative / staff movement

Waiting - idle time between operations or activity

Over Processing - doing more than is required by the customer(s)

Over Production - producing more than is necessary

Defects - errors, poor quality, rework and scrap

Skills - not fully utilising the skills available within the business

The acronym 'TIMWOODS' is used as a means of remembering these wastes. 

Identifying waste is a critical task in any business and should be within everyone's role or remit. However, this should be approached with caution as it can result in the creation of a blame culture.

Reducing Waste

Waste identification is a good thing. The ability to identify waste in the business, and to have strategies for dealing with the wastes identified can prove to be very cost effective in terms of the effort involved.

You can use the simple Waste Matrix below to provide an overview of the symptoms of waste which may be present within your organisation and to identify some of the strategies and tools for dealing with them.

Waste reduction needs to be part of an overall improvement strategy, whether you use a Lean approach, Six Sigma tools or any other Continuous Improvement methodology, the objective of any change should be focused upon:

  • Reducing Costs
  • Improving Quality
  • Improving Delivery

These measures are referred to as Q C D

New Call-to-action


Topics: Root Cause, root cause analysis, Global 8D, G8D, Interim Containment Action, Permenant Corrective Action, Is/Is Not, problem prevention, Problem Desciption, 8D, 8D benefits, Problem solving, Continuous Improvement, ICA, decision making

SPC - Probability And SPC

Posted by Graham Cripps on Mon, Jul 13, 2015 @ 02:39 PM

Probability And SPC

Welcome to the third article in the 'Explaining SPC' series, written by our Subject Specialist Graham Cripps.


Probability is the statistical method for predicting the chances of a single or series of events actually happening.

For example, if I toss a coin in the air, assuming no other influences are present, I can predict that I will get either heads or tails - two possible outcomes from one event. This can be expressed as:

  • The probablity of a head is 1/2
  • The probability of a tail is 1/2

If I now consider having two coins that are tossed then the outcome could be the same for each coin. However, if we consider that the outcome we are looking for is all heads, then we can see that the outcomes could be:

SPC_B3_P1

We can see that we have four possible outcomes so the probability of one of these is 1/4 (or 1/2 x 1/2).

If we had seven coins, the probability of getting all heads, or any other outcome, would be:

1/2 x 1/2 x 1/2 x 1/2 x 1/2 x 1/2 x 1/2 = 1/128

This is usually written as 27 (2 to the power of 7). In other words, two possible outcomes from seven different coins.

Variation

Variation is present in all things - be it manufacturing a shaft, filling a milk bottle or formulating ink colour, there will be some degree of variation.

There are two types of causes of variation:

  • Common Causes
  • Special Causes

Common Causes are due to the natural variation, always present in and around a process, under normal running conditions. These will include those coming from man, machine, measurement, materials, equipment, methods and environment (both internal and external environments).

Special Causes are due to a change condition, something has changed in or around the process that is abnormal.

A process that has only common causes present is said to be in control. In other words, the outcome of a process can be predicted within the realms of probability.

SPC can only be applied on a process that is in control as predicting special causes of variation is not feasible.

So let us take a look at how SPC can predict an outcome based upon the output of the process itself.

SPC - Predicting Outcomes

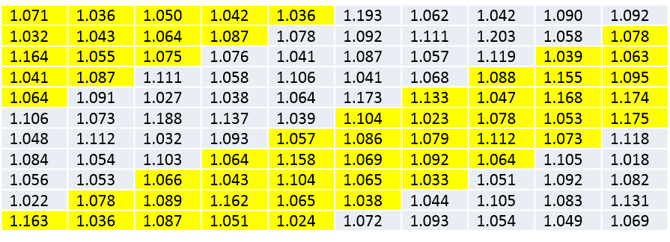
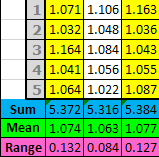
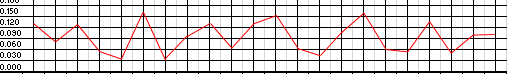
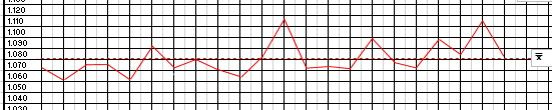
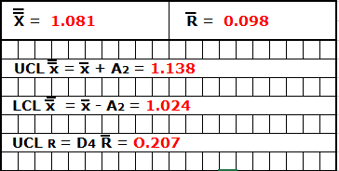
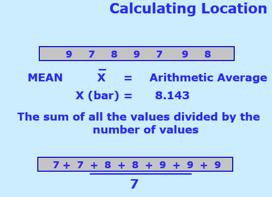
A process has been measured for a few days. The data gathered is based upon a sample size of five taken every hour. The data has been plotted on a histogram and we have calculated the mean of the data (mean of all the means, X-bar), the range and the distribution (the sigma value or σ)

SPC_B3_P2
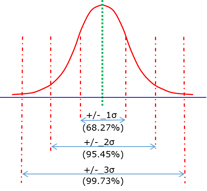
This diagram describes the past process output, based upon the data gathered. If we consider plus or minus three sigma (+ - 3σ), it is a function of a normal distribution that 68.27% falls within the cente third, 95.45% within the centre two thirds and 99.73% within + - 3σ.

Only 0.23% of all data falls outside of + - 3σ.

Finally, the data is equally spread about the mean.

These statistical facts form the basis of the application theory of SPC

Let me explain how this works. For any set of sample data from now on (sample of five) we can predict that the data points will follow these patterns.

So the likelihood that seven sets of consecutive samples behave outside of these patterns (i.e. one single outcome repeated from eight possible outcomes) then the probability against would be 1 / 128.

The eight possible outcomes for sub-group values are:

  • All above the mean
  • All below the mean
  • All within the + - 1σ
  • All within the + - 2σ
  • In one half of the distribution
  • All going up
  • All going down
  • In the outer 1/3 area

We will come back to this again in future articles

Download Your SPC Dice Plotting Exercise

As always please let us know if you have any questions or feedback, you can call us on 01371 859 344 or contact by email us on julie.camp@resultsresults.co.uk 

Topics: Continuous Improvement, Statistical Process Control, SPC

Mental Toughness - The Component Parts

Posted by Julie Camp on Fri, Jul 10, 2015 @ 04:21 PM

Mental Toughness - The Component Parts 

New Call-to-actionWhy not enter our FREE Prize Draw to win a Mental Toughness Assessment for your organisation, use the button on the left.

Second in the Blog series - Mental Toughness - What is it? Paul Caffery, MD of ResultsResults, explains the components of Mental Toughness - Control, Commitment, Challenge and Confidence. plus the opportunity to ask him a question directly!

JC "Paul, you've told us that there are four component parts to Mental Toughness - Control, Commitment, Challenge  and Confidence, can you expand on what each of these means? Lets start with Control"

PC "Certainly Julie. Control, in mental toughness terms, can be explained in two dimensions - Life Control and Emotional Control. If someone has a high level of Life Control it means that they really believe they can do anything they can set their mind to. Having a high level of Emotional Control means they can manage both their own emotions and the emotions of others.

JC "How would that benefit someone?"

PC "Well if you have high levels of control you are more easily able to focus on facts and reality without getting drawn into assumptions (misled) and less likely to feel that you cannot make progress because of the way that somebody else is 'acting up'......."

JC "Great. What about Commitment?"

PC "Commitment is about Goal Setting and Achieving. People with high levels of mental toughness enjoy setting themselves goals and doing whatever it takes to keep their promises and achieve these goals!"

JC "Thats how we like people to be! Okay, what about Challenge?"

PC "When we are talking mental toughness, Challenge is about Drive and Adaptability. People with high levels of mental toughness learn from experience and take calculated risks, they see setbacks as an opportunity to learn and they will push to succeed"

JC "Right so someone who is mentally tough will not just give up at the first sign of an obstacle, they will keep trying, and adapt their approach if required. And Confidence?"

PC "Confidence is about having the ability (or being able to acquire the ability) and the interpersonal confidence to influence others in order to get their 'buy-in' to ensure you can complete a piece of work or project. Also having the confidence and ability to stand your own ground when necesssary!"

JC "Brilliant! Sounds like my sort of person"

PC "Yes, they are great people to have around if you are serious about driving improvements through your business, and sustaining them. However, please remember my health warning  - managers have a responsibility to manage the environment and processes at work so that unnecesssary stresses are removed from the workplace. My top tip is to find people within the organisation with high levels of mental toughness and get them to help you"

JC " Thanks Paul, another great tip!"

If you have any questions about Mental Toughness and the MTQ48, use the form below to ask Paul directly


 Mental Toughness - Ask Paul A Question!

Topics: People Development, Management Tools & Techniques, Mental Toughness, Business Resilience, Leadership

SPC - The Basic Statistics Behind SPC

Posted by Graham Cripps on Thu, Jul 09, 2015 @ 03:04 PM

SPC - The Basic Statistics Behind SPC

This is the second article in our SPC Blog series, aiming to provide a background to the statistics behind Statistical Process Control (SPC) for variable data.

Variable data is derived from anything that can be measured and includes length, diameter, hardness, distance, volume, mass and gloss levels to name but a few.

Basic Statistics are used to convert large amounts of data into a more meaningful form. For me, this is about making pictures from numbers.

SPC requires information or data to be described using three terms:-

  • Location - where the data is located on a line of continuum
  • Spread - the smallest to largest measurement taken
  • Distribution - the way the data is located relative to a central data value

Location - Measures Of Central Tendency

Central tendency describes the location of a set of data. The three descriptors are mean, mode and median.

  • MEAN is the arithmetic mean or average
  • MODE describes the most frequently occurring value
  • MEDIAN is the value of the middle value when all the data is arranged in ascending order

The following two slides illustrate the calculations for all three of these measures (Mean, Mode and Median)

SPC_B2_P1       SPC_B2_P2


Where these measures are useful depends on the data set you are using. For example we will use the mean value and sub-group size of 5 samples. Having sub-group samples means we can take advantage of the central limit theorem to be abe to manage data analysis from normalised values.

This provides the advantage of reviewing the data as a normally distributed set of data (more about this in the next article)

Spread

This is simply the difference between the largest and smallest data points or measurements.

Distribution - Measure Of Dispersion

Measures of dispersion define the spread of data and the overall shape of the data. 

If we consider a simple histogram then we can see that there is more than one measure needed to describe the data set.


SPC_B2_P3
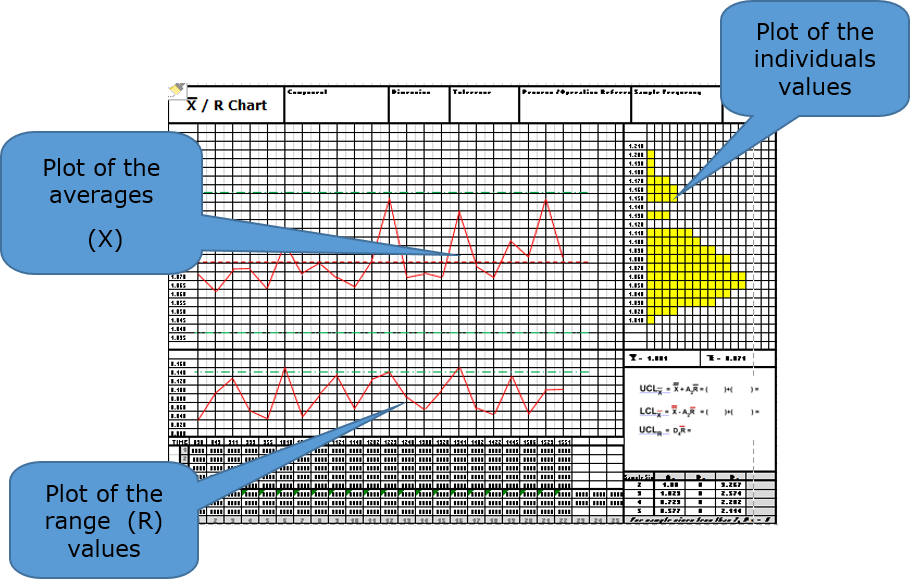
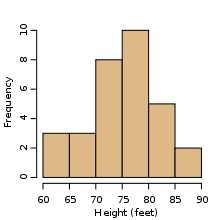
This diagram shows a typical histogram for a linear set of data. This type of graph is very useful for visualising small or large sets of data points, in terms of the distribution, and can be produced using Microsoft Excel.

However, for us to analyse this data further, we would need to overlay a distribution curve for this data.


SPC_B2_P4


This diagram illustrates three sets of data, all centred on the same value, but the spread and shape of the data sets vary (the spread is the difference between the highest data value and the lowest data value)

You will also notice that, although the last two data sets share the same location and the same spread, the shape is different.


So we use three descriptors to describe the data:

  • location
  • spread
  • shape of the data

Summary

Location is defined by the mean, mode or median value (the diagram above shows the mean for a normal distribution)

Spread is defined by the range (R) value for the data (difference between the highest and latest data points in absolute values).

Shape of the data is defined by the variance (the average of the squared differences from the mean) and is commonly referred to as the sigma (σ) value.

Download your 6σ Conversion Chart 

Topics: Continuous Improvement, Statistical Process Control, SPC

Mental Toughness - What is it? Do organisations need it?

Posted by Julie Camp on Wed, Jul 08, 2015 @ 09:59 AM

Mental Toughness - What Is It?

New Call-to-action Why not enter our FREE Prize Draw to win a Mental Toughness Assessment for your organisation, use the button on the left!

Interview with Paul Caffery - MD of Results Results

I recently had a conversation with Paul Caffery to find out more about Mental Toughness, a term often used in sport but becoming increasing prevalent in industry.

JC "Paul, what is Mental Toughness?"

PC "Mental Toughness describes the mind set that every person adopts in everything that they do. It is closely related to qualities such as character, resilience, grit etc. You could define it as 'A personality trait which determines, in large part, how people respond to challenge, stress and pressure, irrespective of their circumstances'"

JC "Do organisations need people with high levels of Mental Toughness?"

PC "Good question Julie. This is the first question you should ask when considering job specifications or potential candidates for a specific role, as many positions within an organisation do not require particularly high levels of mental toughness. However, if mental toughness is a core requirement for a role, then the good news is that it is something you can test for and develop in your selected people.

JC "We hear a lot about Mental Toughness in sport, what sort of roles would require high levels within industry?"

PC "We would expect people in roles such as Six Sigma Black and Green Belts, Continuous Improvement Co-Ordinators, Team Leaders or Supervisors, Managers, anyone involved in Lean Implementation to typically require high levels of Mental Toughness. These people can then help to improve your organisation's performance by developing new skills in themselves, whilst co-creating and improving the work environment and processes with the rest of your team. This in turn makes the new state of performance sustainable, whilst encouraging them to improve it further"

JC "What are people with high levels of Mental Toughness typically like?"

PC "A mentally tough person tends to be sociable and outgoing; being able to remain calm and relaxed, they are competitive in many situations and have lower anxiety levels than others. They also have a high sense of self-belief and an unshakeable faith that they have control of their own destiny. These individuals can remain relatively unaffected by competition or adversity, performing to the peak of their ability in terms of performance, behaviour, well being, resilience, aspirations, employability and the ability to bring difficult situations to a satisfactory conclusion.

JC "Thanks for the explanation Paul, anything else we should know about Mental Toughness?"

PC "Yes! I would like to issue a health warning about Mental Toughness, because the organisation and its management team are always responsible for ensuring that unnecessary and undue stresses are not placed on your people. It is counter-productive to require mentally tough individuals to cope with situations that should be managed and remedied by you!"

JC "Noted! Thanks Paul"


This is the first in our upcoming series on Mental Toughness, sign up to our Blog, Facebook page and Twitter channel to ensure you receive notification of new posts on this topic


Topics: People Development, Management Tools & Techniques, Mental Toughness, Business Resilience, Leadership

SPC - Understanding Statistical Process Control

Posted by Graham Cripps on Mon, Jul 06, 2015 @ 12:07 PM

Understanding Statistical Process Control (SPC)

Having reviewed feedback from visitors to our website we have found that we get a lot of requests for information on Statistical Process Control (SPC).

SPC_blog_chart_1
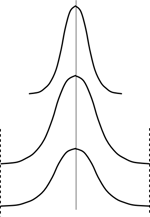
We will be launching a series of articles during the next couple of weeks that aim to provide a foundation understanding of SPC and it's application, this will hopefully help you make an informed choice about whether SPC is the correct tool for you!

Our intention is to provide a solid foundation for understanding SPC, the terminology, metrics and uses of SPC along with  useful resources which can be downloaded and customised to suit your specific requirements, the first of which (X-bar and R chart) is available below.

My job takes me into all types of business, and I often find SPC charts being displayed, but when I ask the client they are either not correctly used or not correctly interpreted.

SPC_blog_chart_2The articles will be broken down into small bite size offerings that can be used for future reference. We will also be making available the relevant resources, including an SPC chart, calculation sheets and a table of constants along with some recommended further reading.


The information will be split into the following articles for ease:

  • The basic statistics behind SPC (for variable data)
  • Probability and SPC
  • Collecting and plotting data (using the X-bar and R chart)
  • Interpreting the chart, including the seven points rule
  • Understanding capability
  • Applying SPC

The article structure will be on our website so if there is something that interests you, keep an eye out!  You can sign up to receive notifications to our Blogs here and our Facebook page can be found here.

If there are any SPC questions we haven't answered, or for any queries or feedback, let us know either via the contact form here or by emailing julie.camp@resultsresults.co.uk


New Call-to-action


Topics: six sigma, Statistical Process Control, SPC

Global 8D (G8D) Frequently Asked Questions (FAQ's)

Posted by Graham Cripps on Thu, Jul 02, 2015 @ 10:59 AM

Global 8D (G8D) - Frequently asked questions (FAQ's)!

The latest in our series of FAQ's answered by our Subject Specialist, Graham Cripps

If the answer to your question is not shown here why not use our 'Ask Us A Question' Form to get an answer from our Subject Specialists!

"When I am asked for an 8D by my customer is it just the 8D Form they want?"

The short answer is NO, however you may not have got to the root cause in the time they give you to provide the 8D.

The G8D Form is a means of recording and reporting the problem solving effort. At D0 you should have implemented an Emergency Response Action (ERA) which must protect your customer from the effects of the problem. This is what the customer needs to see as quickly as possible.

Don't forget, other than the initial effect (or symptom) of the problem, the ERA can also introduce an effect in itself e.g. a supply constraint, so make sure these are included as part of your ERA.

Finally, you should always confirm understanding with your customer.


 Download Your G8D Problem Solving Workbook

"Do I need to use Global 8D for every problem I encounter?"

I need to answer this in two parts:

1. When to use a full Global 8D - there are some simple rules to follow. G8D should be applied to those problems that have:

  • definition of the symptom(s), that is the symptom has been quantified
  • identified the customer(s) and affected parties who experienced, or are experiencing, the symptom(s)
  • measurements to quantify the symptom(s) and demonstrate that a performance gap exists and / or that the priority (severity, urgency, growth) of the symptom warrants initiation of the process
  • an unknown cause
  • management commitment to dedicating the necessary resources to fix the problem at Root Cause Level and to prevent recurrence
  • a problem symptom complexity that exceeds the abillity of one person to solve the problem

2. The problem solving process is all about getting to root cause, eliminating the root cause and then fixing the reason why the problemm occurred in the first place. It matters not what process you use but I would suggest that the Global 8D steps offer everything a determined problem solver could want. You will clearly define the problem, protect your customer, get to root cause and make sure it stays fixed by addressing what allowed it to occur in the first place.


Download Your Global 8D Assessing Questions


"Is Global 8D the only problem solving tool to use?"

There are many tools and techniques available but I have found that there are two approaches that have served me well.

1. Global 8D is applied to those bigger problems that have:

  • definition of the symptom(s), that is the symptomhas been quantified
  • identified the customer(s) and affected parties who experienced, or are experiencing, the symptom(s)
  • measurements to quantify the symptom(s) and demonstrate that a performance gap exists and / or that the priority (severity, urgency, growth) of the symptom warrants initiation of the process
  • an unknown cause
  • management commitment to dedicating the necessary resources to fix the problem at Root Cause Level and to prevent recurrence
  • a problem symptom complexity that exceeds the abillity of one person to solve the problem

2. The 5 WHY's (5Y's) is the other very useful tool. However I would recommend that you follow these basic steps:

  • define the problem by describing 'What is wrong with what?'
  • protect the customer (internal or external)
  • describe the problem fully (what? when? where? and how big?, using real data)
  • brainstorm all of the possible causes of the problem (not of the effect or symptom!)
  • arrange on a fishbone diagram
  • Use 5Y's to drill down to root cause level
  • develop causal theories that can describe how the root cause(s) results in the problem and the effect
  • test and verify potential root causes to get to verified root cause
  • determine and implement the 'best' permanent corrective action(s)
  • make it the new way of running the process


Download Your Global 8D Assessing Questions


"How will Global 8D help my business?"

If you have ever said, or heard said "The last time we had this problem we did this" or "Why does this problem keep coming back?", then you did not get the problem solved!

Global 8D has the discipline to ensure that not only is the problem solved at root cause but what allowed the problem to happen is also fixed (the root cause of the root cause)

It's true to say that Global 8D should not be used for every problem. In fact something like only 5% of problems warrant the full use of this problem solving methodology. 

Other methods are available but again, I would recommend using the same steps as G8D for all problems to ensure you ask all the right questions at the right time and fix the problem at root cause permanently. 

Download Your Problem Solving Case Study

"Do I need to have a team trained for Global 8D?"

Yes but there are many ways of achieving this, from a standard instructor led programme to self-tutoring using available materials. The best way, in my opinion, is to have a Problem Solving Application Workshop run, which will deal with and resolve a live problem whilst training the team how to use the tools and techniques of Global 8D.

Download Your G8D Problem Solving Workbook

Global 8D Application Support Workshop


Why not have a look at our Global 8D Overview page, where you will find all of our templates, reports and other useful documents available for FREE download.

Topics: root cause analysis, Global 8D, G8D, Interim Containment Action, Permenant Corrective Action, Is/Is Not, problem prevention, Problem Desciption, 8D, 8D benefits, Problem solving, Continuous Improvement, ICA, decision making

Subscribe via E-mail

Latest Posts

Posts by category

Follow Me