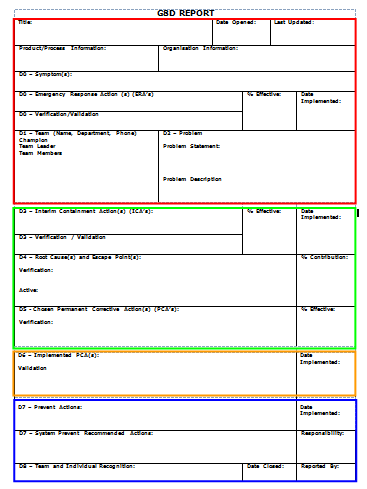
Global 8D – D2: Define the Problem

Defining the problem is a process for 'digging down' and getting a more detailed and refined understanding of the problem.
At this stage of the problem solving process we are looking to provide concise data and determine the exact nature of the problem.
A common problem in any problem solving activity is distinguishing between the problem and the symptom of the problem.
Describing the problem is carried out in two stages:
Problem Statement - A concise statement that identifies the object experiencing the defect and the nature of the defect (the defect will typically be a symptom for which the cause is unknown)
Problem Description - Established by asking the question "What is wrong with what?" and testing it with repeated Whys (Stair-stepping)
Problem Statement
At this stage it is important to note that problem solving is about taking all of the data and information around the problem (or symptom) and drilling down, using a structured process and a multi-disciplined team. However, if assumptions are made without gathering the data, too often the symptom may well become the focus of the effort rather than the problem itself
Let me explain using a simple example
Example: “Every time I put the wall mounted heater on in the kitchen it blows a fuse”. So, the problem is the heater and the symptom or effect is a blow fuse? This is an assumption at this stage as we do not have any other information like:
-
How much load is on the circuit already?
-
Is the socket used for any other electrical appliance of this size?
-
Has the heater been plugged into another socket to try it out?
-
And so on……
This is a simple example but does demonstrate how easy it is to jump to what appears to be a natural conclusion.
If we are to get to the bottom of the problem and fix it for good then we must be driven by facts and not assumptions.
Starting with the problem description, we must ensure we keep focused on what we know. So using the above example and what we actually know at this point, using the sentencing technique of what is wrong (the problem) with what (the object), our problem statement becomes 'the fuse blows'
So, if I assumed that the heater was faulty, scrapped it and bought a new one, would this necessarily solve the problem? At this point I don’t actually know. However, think about a problem in the workplace and how expensive replacing an item could end up!
We now have a problem statement, we now need to look at developing this to a full problem description
Problem Description
A Problem Description is the output of a process that utilises the IS/IS NOT Form to amplify the Problem Statement. This is the next step in better understanding the problem.
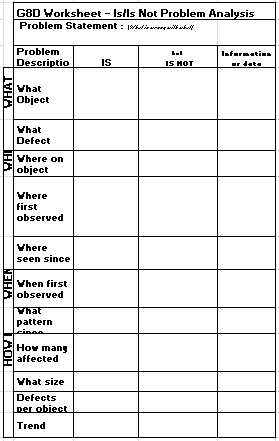
This techniques looks at 'what the problem is and what the problem is not but logically could have been' and looks to provide information on:
what the defect is/is not but could be
where it does/does not occur but could
when it does/does not occur but could
how big it is/is not but could be
The IS/IS NOT process also identifies data that needs to gathered where necessary to better understand the problem.
Example: A factory is making metal lamp shades for the domestic market. These are fabricated and then painted using a robotic paint plant in several colours. Some of the blue finished product has a defect, paint runs. Therefore:
What: the problem is on the blue lamp shades and is not on any of the other colours, but could be
Where: the defect is on the top flat and is not anywhere else, but could be
When: the defect is apparent after the finish coat and is not apparent after the base coat
How big: the defect is consistently on 20% of all blue product and is not higher or lower, increasing or decreasing but could be.
NOTE: This is only a part of the data and information that is gathered during this process. For more information download our free Is/Is Not template by clicking on the button at the end of this article.
The problem description could now be formatted as follows:
'20% of the blue finished product are consistently rejected for paint runs on the top flat. Defects are not seen after base coat'
Next Time
Having determined what the problem is and what it is not, the next article will be focusing on what is the differencebetween the products that have the problem and those that do not and what has changed for the problem to have appeared.

Graham Cripps
Results Consortium Ltd


 The possible outcomes could be any one of the following eight: